Motorly Market Index
Ireland's Used Car Market Intelligence · Week of 2 November 2026
What do these Irish used-car prices measure?
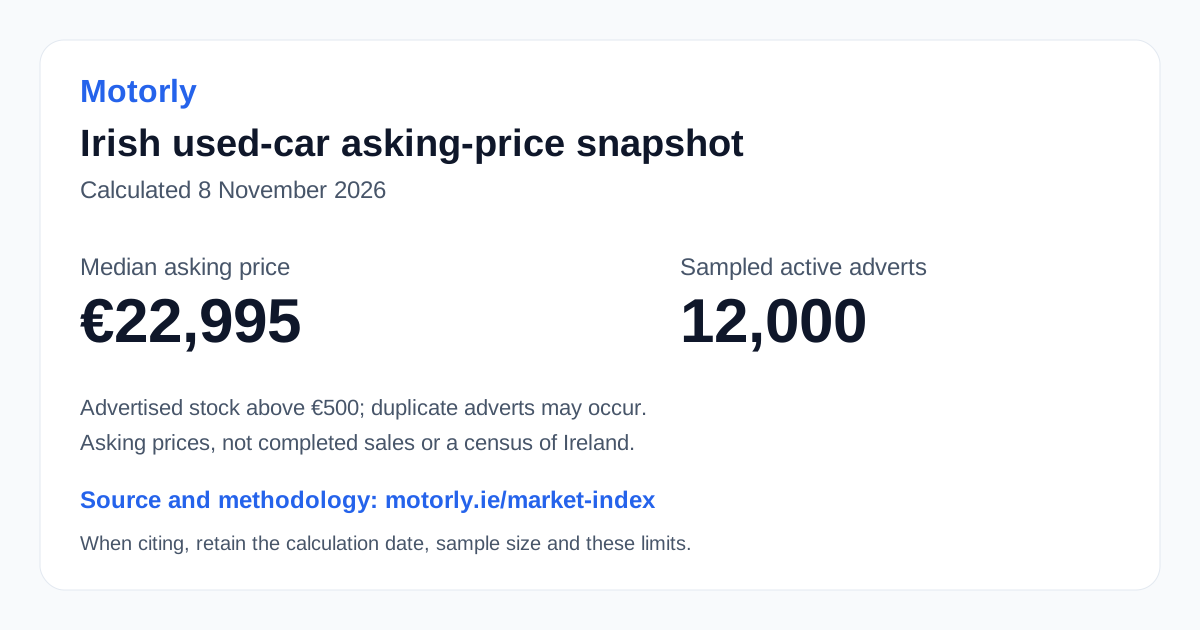
The median asking price in this sample is €22,995, based on 12,000 sampled active adverts. This snapshot was calculated on 7 November 2026. These are advertised prices, not confirmed sale prices or valuations of individual cars.
Inventory totals and new-listing counts are estimates. Prices and fuel shares describe the sample, which is not a census of the Irish market. Read the method and limitations before comparing or citing figures.
239,242
Active Listings
€22,995
Median Asking Price
120
New This Week
83,616
Left the Market (30d)
15.7%
EV Share
Market Signals
New-listing Activity
Below reference
Listing Turnover
high
EV Share of Sample
15.7%
By Fuel Type
By Age Band
Top 20 Makes by Volume
Volkswagen
921 · €27,950
Kia
790 · €26,900
Ford
674 · €21,950
Mercedes-Benz
665 · €32,950
BMW
597 · €29,995
Hyundai
574 · €26,474
Toyota
516 · €18,950
Audi
511 · €28,950
Peugeot
429 · €22,085
Nissan
398 · €12,925
Citroen
377 · €12,950
Opel
354 · €18,800
Renault
343 · €16,900
Skoda
342 · €25,995
Honda
314 · €12,820
Suzuki
270 · €25,000
Mazda
266 · €22,948
Volvo
231 · €24,500
Vauxhall
169 · €4,250
Fiat
161 · €12,950
Makes Leaving the Market Most Often
Share of the 10,000 most recent adverts that left the market.
#1
Volkswagen
15.1%
#2
Toyota
10.4%
#3
BMW
8.6%
#4
Audi
7.6%
#5
Ford
6.8%
By Body Type
Method and limitations
- Price and fuel statistics use a bounded sample of active adverts with asking prices above €500. The median is the middle asking price after sorting, or the average of the two middle prices for an even sample.
- Third-party adverts must have been observed in the last 14 days. Active first-party Motorly adverts may have older or missing observation dates.
- One car may be advertised more than once. Advert counts are not counts of unique vehicles, and the sample is not a random or complete survey of Ireland.
- Inventory totals are estimates. New-listing counts scale the share of recently first-observed adverts to that estimated inventory; first observed does not necessarily mean first advertised.
- New-listing activity compares estimated new adverts with a reference of one twenty-sixth of estimated inventory, using a 15% band either side. It is a heuristic, not an observed increase or decrease over time.
- An advert has left the market when it stops being observed on the monitored sources; the headline counts the last 30 days. An advert seen again later, or a car still on sale on another monitored site, is not counted. Leaving the market does not confirm a sale, its price or the reason the advert ended.
- Listing turnover compares adverts that left the market in 30 days with estimated inventory: high above 15%, moderate above 5%, otherwise low.
- Fuel shares describe advertised stock in the sample. They do not measure registrations or national EV adoption.
- When citing this page, retain the snapshot date (7 November 2026), sample size (12,000 active adverts), asking-price basis and estimation limits.
Questions or corrections: john@motorly.ie. Individual price-badge methodology.
Based on 12,000 sampled active adverts and 10,000 adverts that left the market. Inventory totals and new-listing counts are estimates; prices and shares describe the sample. · 7 November 2026
Share the asking-price snapshot
Use this image with its calculation date, sample size and limits. It refreshes from the same cached data as this page; it is not a record of completed sales.
 Download the SVG snapshot
Cite: Motorly Market Index, calculation date shown in the image, asking-price sample. Source: motorly.ie/market-index.
Embed the current snapshot
<a href="https://motorly.ie/market-index"><img src="https://motorly.ie/market-index/snapshot.svg" alt="Motorly asking-price snapshot: retain date, sample size and limits" width="1200" height="630" style="max-width:100%;height:auto"></a>